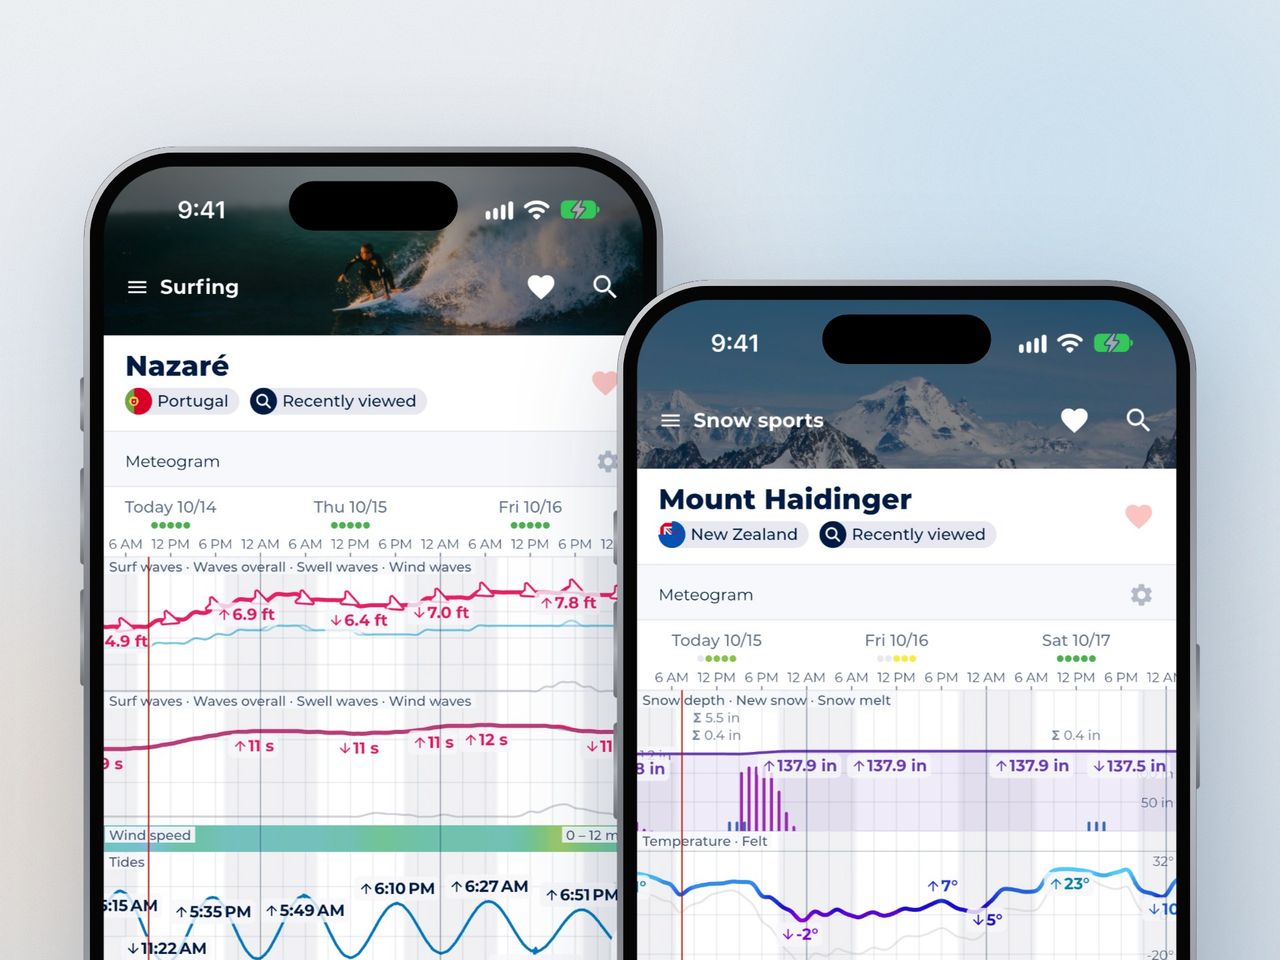
Sonuby 1.9 replaces the meteogram with a new one: every forecast now sits on one timeline that you can drag, zoom and touch to read the exact values. With Enthusiast, you can also choose what it shows and how.
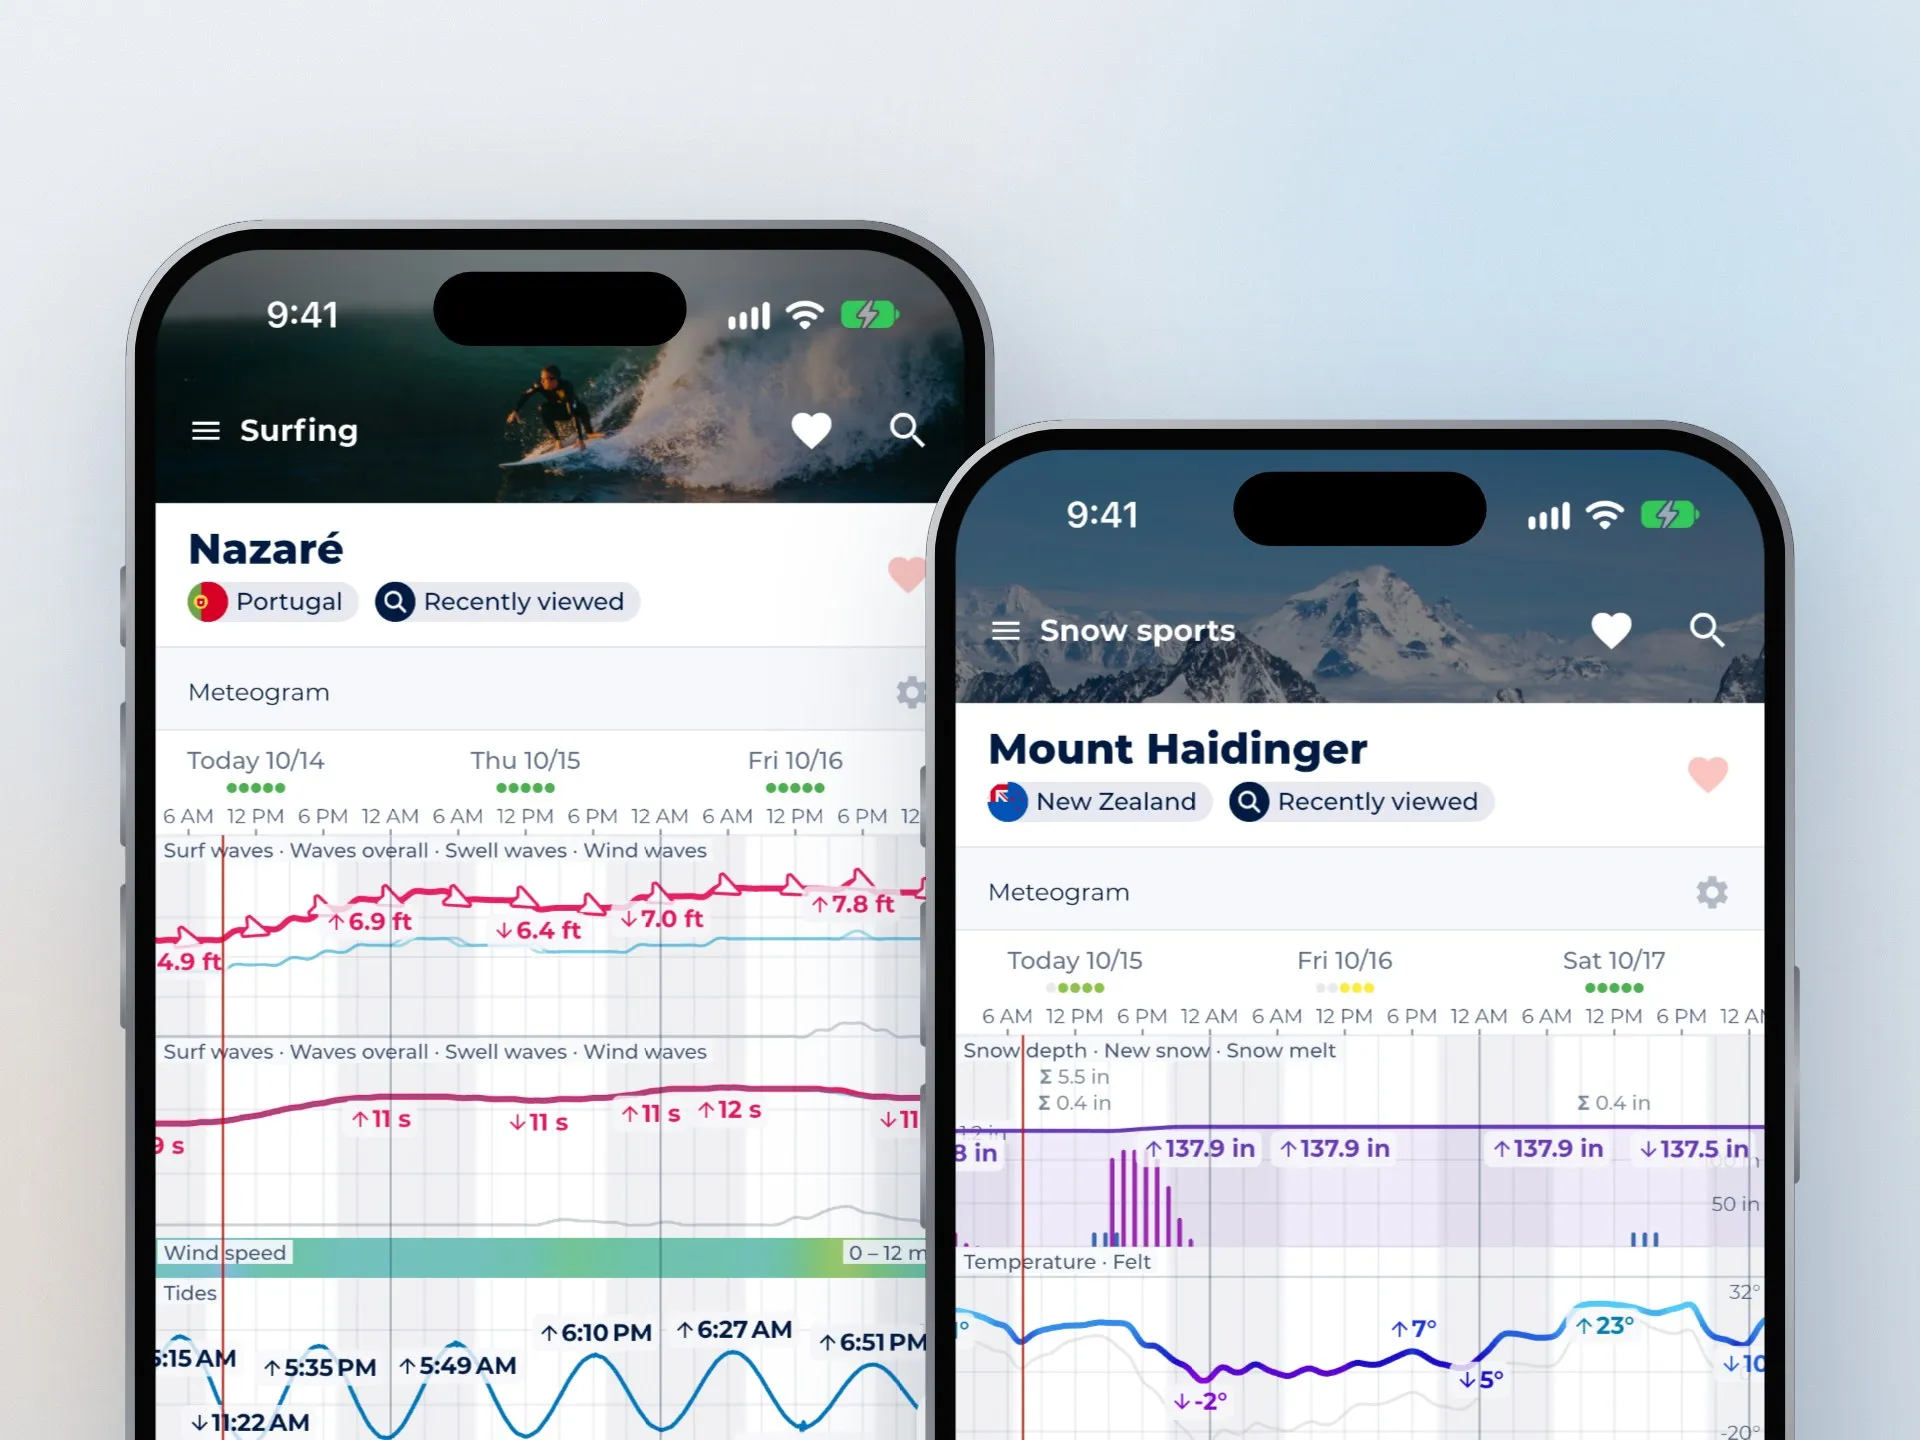
The new meteogram in the surfing report for Nazaré (left) and the snow sports report for Mount Haidinger.
All rows of the meteogram now move together. Drag with one finger to move through time, and pinch to zoom from a single day out to the whole forecast. It opens on the current hour, the minus and plus buttons below it change how many days you see, and the calendar button takes you back to now.
Each day shows its date, how confident the forecast is, its high and low, and its totals for rain, snow and sunshine. Numbered lines across each panel let you read values straight off the chart.
All of this is free for up to 7 days. Seeing more days needs Enthusiast.
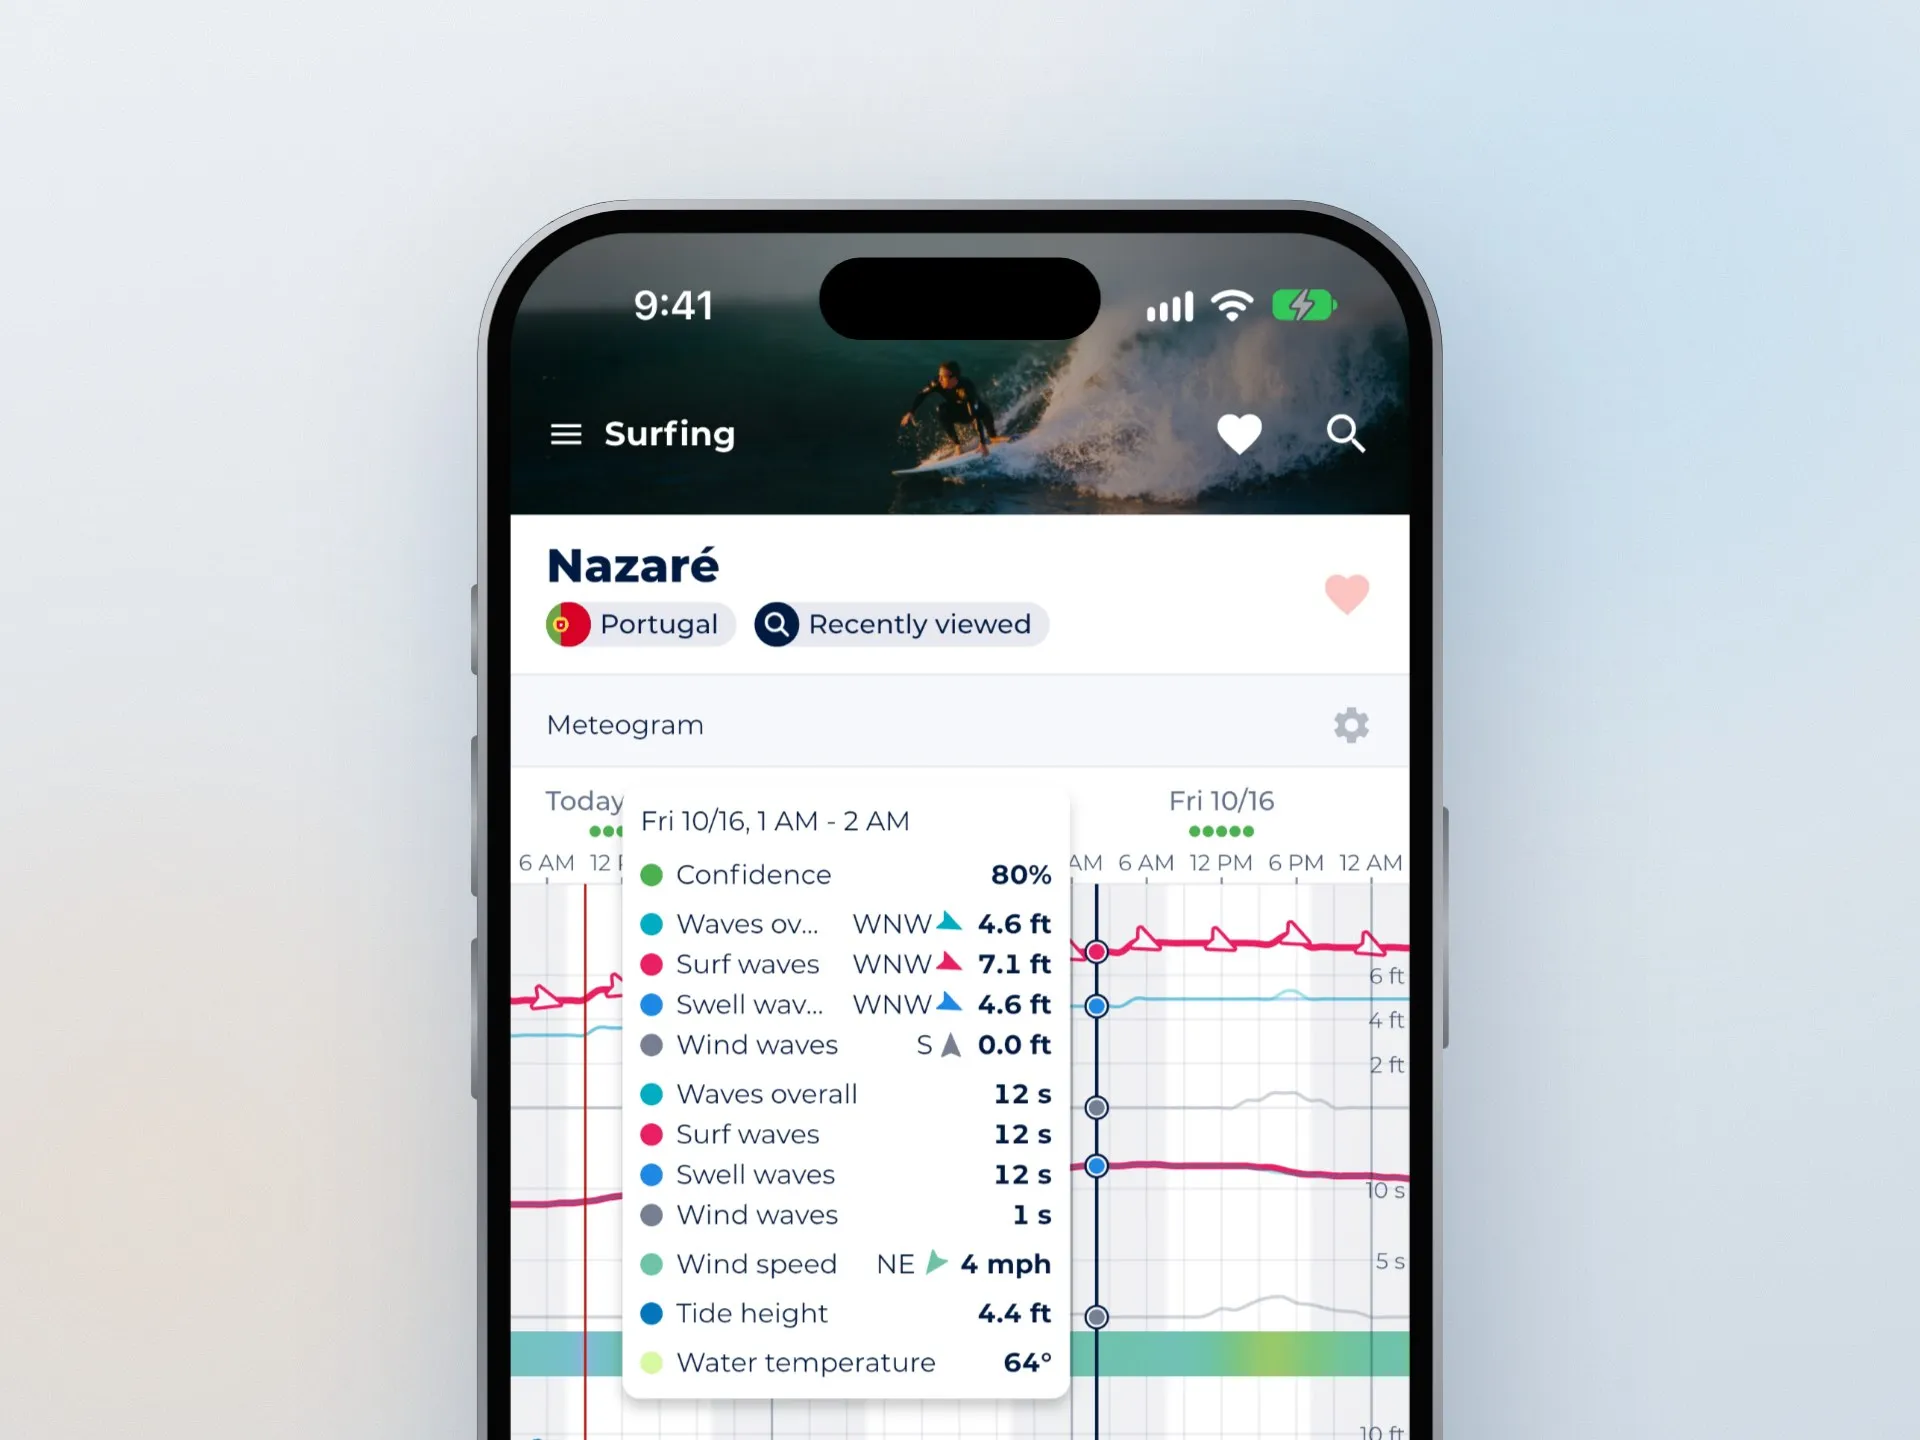
Touch and hold the meteogram to see every value at that hour.
Touch and hold anywhere on the meteogram, and a card opens with every value at that hour: in the surfing report, the wave heights and periods, the wind, the tide height and the water temperature.
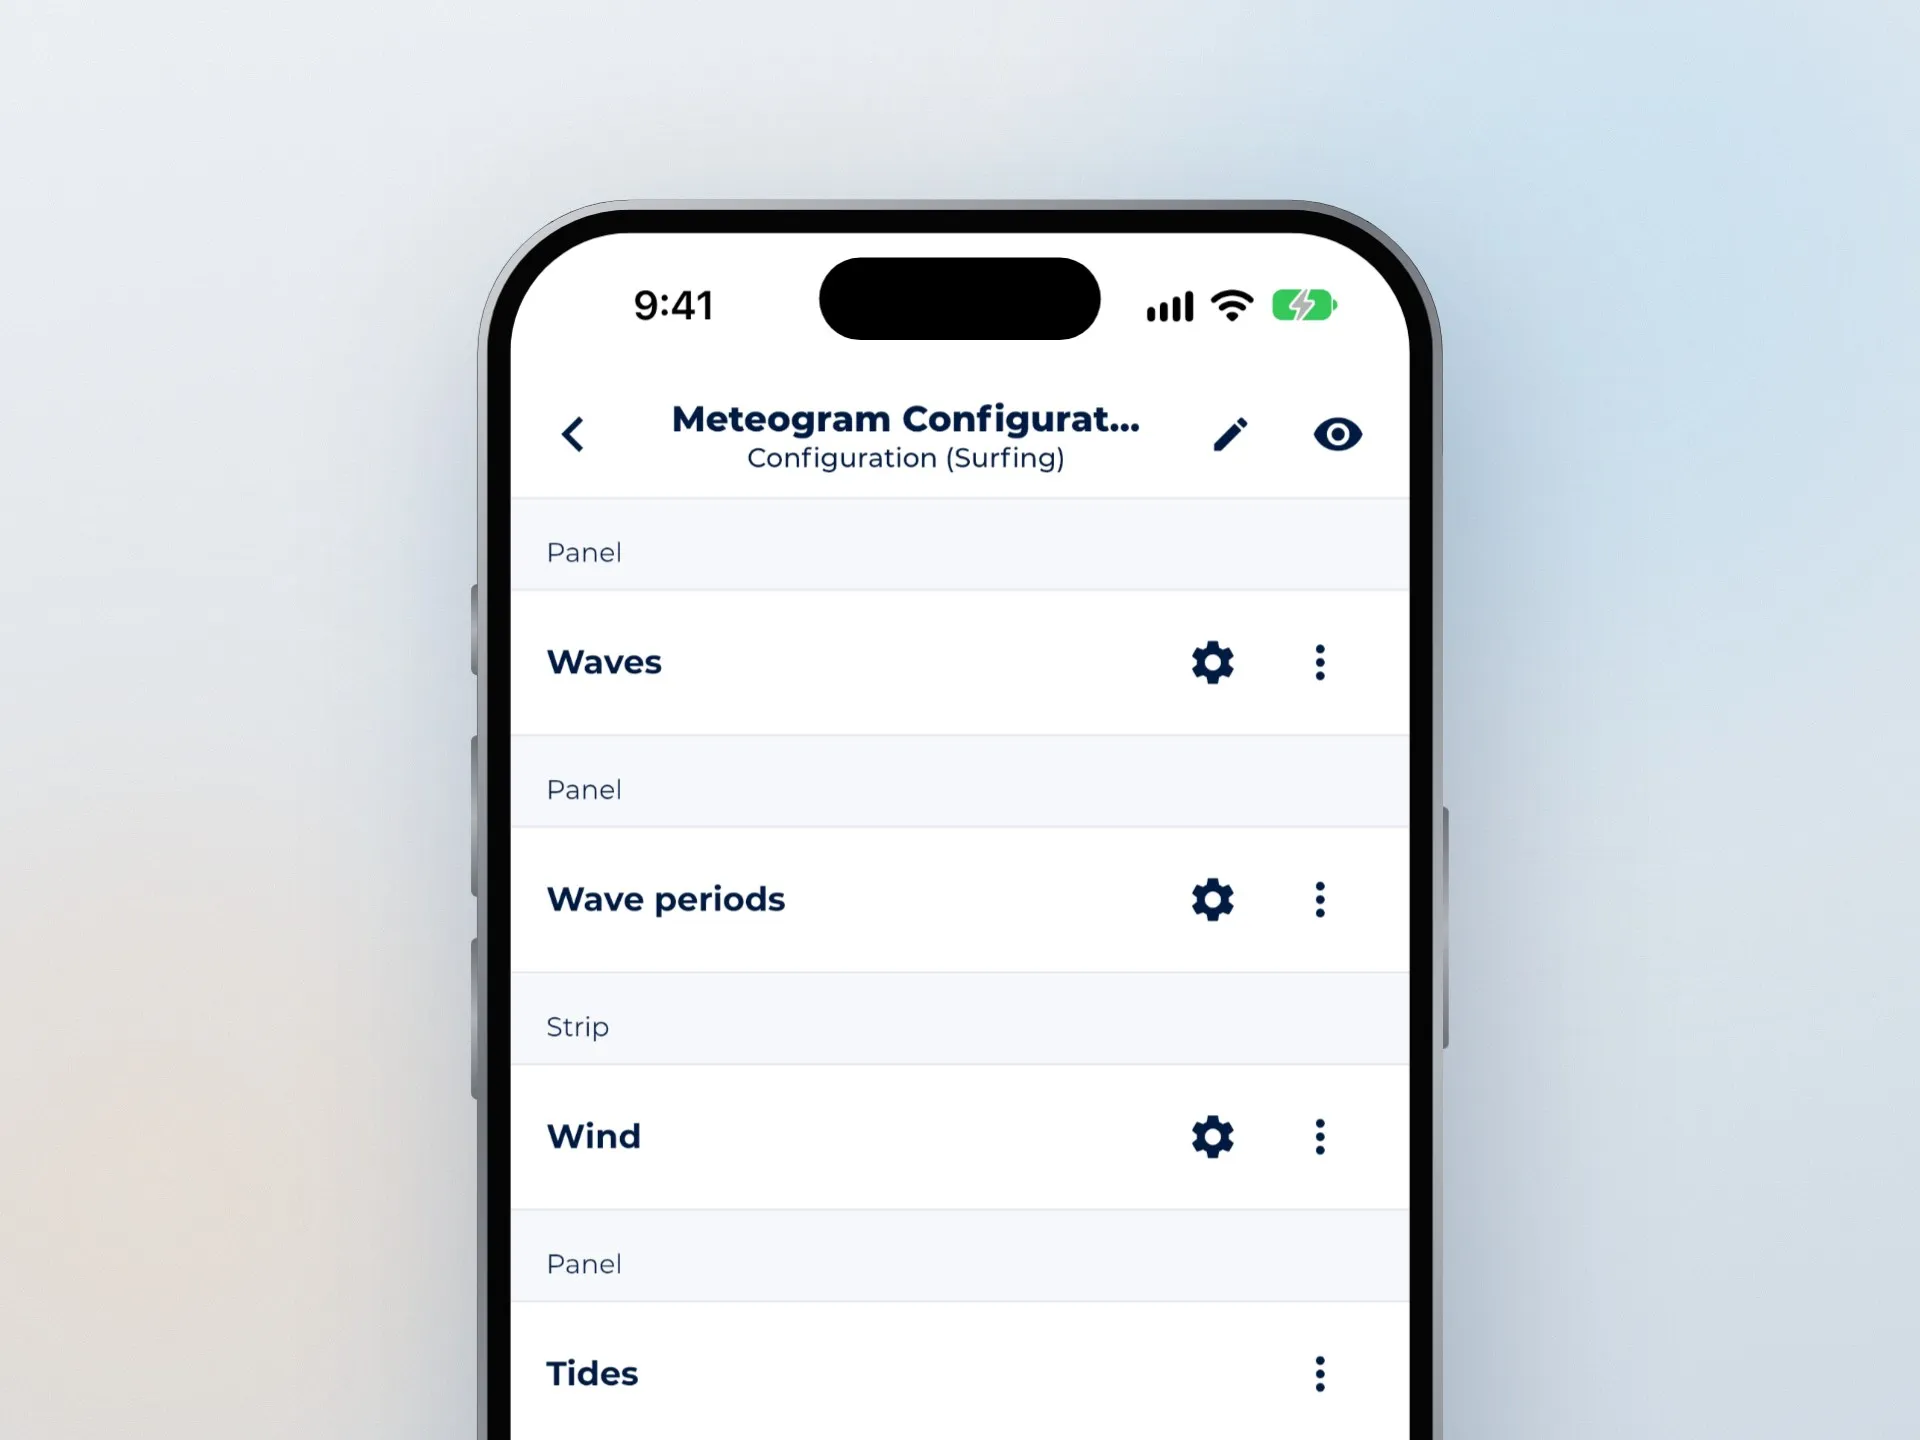
Choose which variables the meteogram shows, and how.
Every report comes with its own meteogram: waves, wave periods, wind and tides for surfing, snow depth and temperature for snow sports. You can change it on the meteogram’s settings page. Add, remove and reorder rows, and let related variables share a panel. Each variable can be a full panel with its own axis, a slim colour band, or only a value in the touch and hold card.
There are new rows to pick from: air pressure, air pollution, humidity, snow, sun elevation, UV index, visibility, thunderstorm risk, and the altitude forecast with wind and clouds through the atmosphere. Some rows have settings of their own, such as CAPE on the thunderstorm panel, dew point or felt temperature on the temperature panel, and the temperature at every height on the altitude chart, up to 1, 2 or 5 km.
Free users get each report’s meteogram as it comes. Changing it, and the settings of its rows, needs Enthusiast.
Sonuby 1.9 is available now on the
Tell me what you think, or what you’d like next, on the Sonuby Feedback Board.
Julian