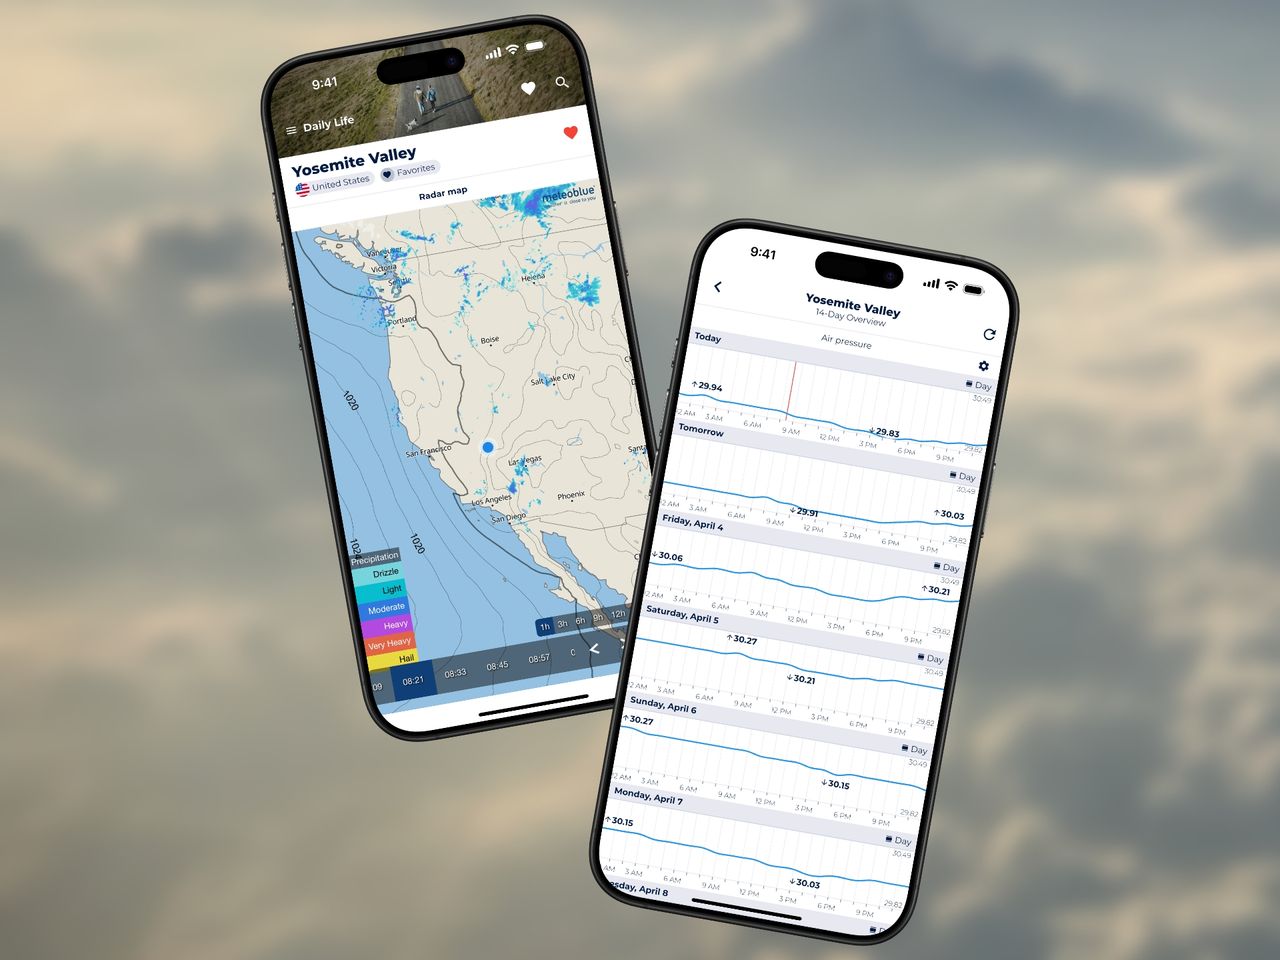
Barometric pressure forecasts, also called atmospheric pressure forecasts, are a great way to predict upcoming weather changes. They are used in a variety of weather dependent fields, including aviation, sailing, and hiking. But changes in barometric pressure can also affect weather sensitive people such as migraine and arthritis patients.
While many weather apps offer basic pressure forecasts, they are usually not as accessible and you will most likely need to tap a few times to get to the barometric pressure forecast section.
Sonuby Weather is different. It provides atmospheric pressure forecasts as comprehensive graphs and map overlays for up to 14 days, and you can even configure it to show them where you want.
In this article, we’ll explore how to access barometric pressure graphs, map overlays and how you can customize Sonuby to be your personal pressure forecast dashboard.
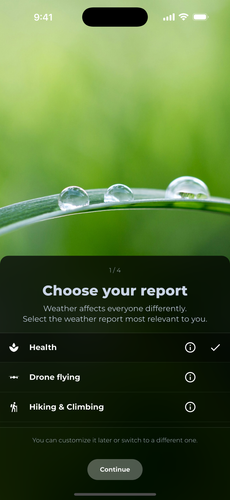
Weather report selection during onboarding.
In your particular case, barometric pressure is relevant to you.
But weather affects everyone differently. To account for the diversity of weather needs, Sonuby is built around the concept of weather reports. Each report is tailored to a specific activity or area of interest, such as Health, Skydiving, Sailing, and more.
Right after you have downloaded Sonuby, you will be prompted to choose your preferred weather report. This will determine which weather variables are displayed in the different forecast sections of the app.
For the purpose of this article, we will first select and focus on the Health report which is pre-configured to show barometric pressure forecasts.
Later, we will switch to the Daily Life report which we will configure to show pressure forecasts more prominently. This way, you will learn how easy it is to customize Sonuby to your needs.
After finishing the onboarding process and allowing the app access to your current device’s location, you will see two different forecast modules for your location: Live Overview and 14-Day Overview. Each forecast module serves a different purpose.
Live Overview shows weather conditions for the upcoming hours and is particularly useful for short-term decision making.
The 14-Day Overview forecast module provides long-term forecasts including barometric pressure of up to 14 days.
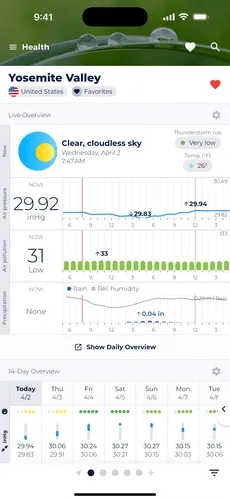
Tapping on the graph will show hourly pressure forecasts.
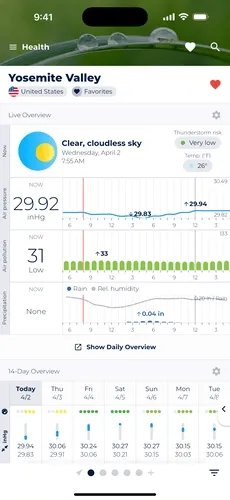
As you can see, the Health Report’s Live Overview prominently displays atmospheric pressure right at the top.
On the left hand side, there is a tile showing the current barometric pressure. Tapping on it will open the barometric pressure graphs for the next 14 days which we will learn more about later.
The graph right next to it shows the barometric pressure values for the previous 3 and the next 21 hours.
You can check barometric pressure values for each hour by tapping on the graph. This will open up a tooltip with the pressure forecast for that hour.
Depending on your location, the current barometric pressure value might be an actual measurement or a forecast value.
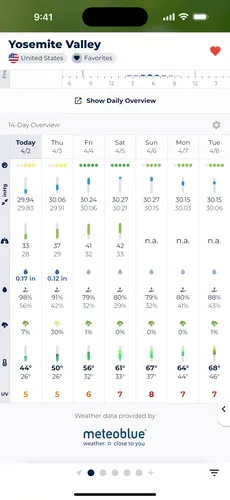
Tap on a day to see detailed hourly forecasts.
If you are looking for a long-term atmospheric pressure forecast, the 14-Day Overview is the right place to go.
It shows the pressure forecast for the next 14 days with the expected minimum and maximum values for each day.
While other weather apps limit you to 7 day barometric pressure graphs, Sonuby’s 14-Day Overview allows you to plan even further ahead.
This allows you to easily see the daily pressure range and plan your activities accordingly.
14-Day Overview also allows you to view the barometric pressure graph for a specific day. Simply tap on the atmospheric pressure forecast for the day you are interested in, and a detailed view of the graph will open.
From there, you can also open the 14-day forecast or move to the next or previous day.
Daily pressure forecasts & more with Daily Overview.
Besides Live Overview and 14-Day Overview, there are two other ways to check barometric pressure forecasts: Daily Overview and 14-Day Barometric Pressure Graphs.
Both can be accessed from Live Overview and 14-Day Overview.
To open Daily Overview from Live Overview, tap Show Daily Overview below the last graph. In 14-Day Overview, tap the day label at the top of the module to open Daily Overview.
Daily Overview provides a detailed breakdown of the weather conditions for a specific day. It shows all variables that have been pre-configured for your selected weather report. In the case of the Health Report, this includes:
Each variable is displayed as a graph, allowing you to see how the weather changes throughout the day.
By swiping left or right, you can navigate between different days. From there, you can also open the 14-day forecast by tapping on 14-Days right above the chart.
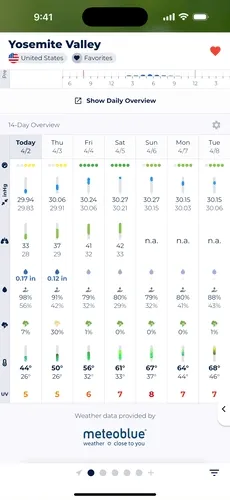
Long-tap on a day’s pressure forecast to open 14-day graphs.
Like Daily Overview, the 14-Day Barometric Pressure Graphs can be accessed from Live Overview and 14-Day Overview.
To open them from Live Overview, simply tap the current pressure tile on the left.
In 14-Day Overview, long-press the daily barometric pressure forecast of any day and tap 14-Day Overview at the top of the pop-up menu.
A new screen will open showing daily barometric pressure graphs for the next 14 days.
As with all graphs, you can tap on the graph to see the exact pressure value for a specific hour.
In case you want to use Sonuby for a different scenario, let’s say for your daily life, but you still want to see barometric pressure forecasts, you can easily configure the app to show them.
To do this, we will first have to switch to the Daily Life report which can be done by opening the sidebar on the left hand side of your screen.
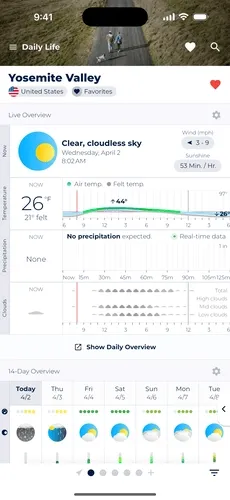
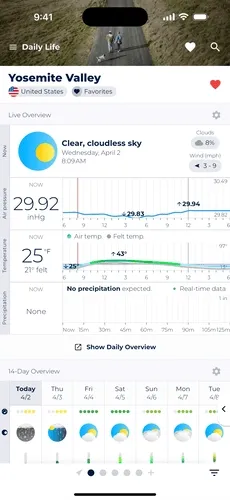
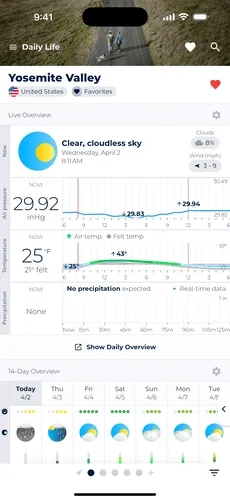
Pressure forecasts become visible by reordering.
Once you have selected the Daily Life report, you will see a new Live Overview module. In order to show barometric pressure forecasts, tap on the cog button in the top right corner of the module.
This will open the settings menu where you can adjust the global settings for Live Overview. In our case, we want to adjust the order of weather variables shown in the module.
To do this, tap on Configuration and scroll down to the bottom of the configuration screen.
Now, tap and hold the drag handle and move the Barometric Pressure variable to the top of the list.
Going back, you will see that the barometric pressure forecast is now shown at the top of the Live Overview module.
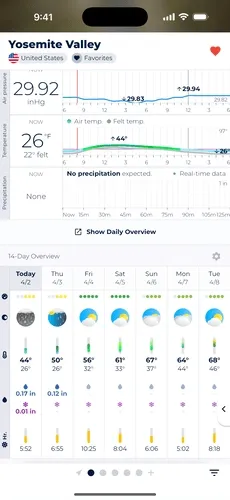
Barometric pressure can be toggled to be displayed.
The process for configuring the 14-Day Overview module is similar to the one for Live Overview. Tap on the cog button in the top right corner of the module, then tap Configuration.
Instead of reordering the variable, you will have to toggle the visibility of Barometric Pressure in order to show it in 14-Day Overview.
If you prefer to show the barometric pressure forecast at the top of the module, you can also drag and drop it to the top of the list.
Once you are done, swipe left twice to go back to the 14-Day Overview module.
Most maps can show an additional isobars layer.
If you haven’t seen it yet, Sonuby also offers a wide range of weather maps.
Many of them allow you to show isobars, which are lines on a weather map that connect points of equal atmospheric pressure.
Isobars are used to visualize the distribution of atmospheric pressure and can help you identify areas of high and low pressure.
To enable the isobar map overlay, first open the map area which can be done by tapping on the map icon in the context menu at the right side of the screen.
Now tap the cog button in which is now visible on the context menu. This will open a settings menu where you can toggle the isobar overlay.
The pressure unit can be changed via app settings.
Barometric pressure forecasts graphs in Sonuby can be shown in both hPa (hectopascal) and inHg (inch of mercury).
By default, Sonuby tries to detect which unit you are likely to prefer based on your locale settings.
However, you can also change the unit manually by opening the app settings via the sidebar menu on the left hand side of your screen.
Scroll down to pressure unit and select the unit you want to use.
As of now, the pressure setting only works for barometric pressure graphs. The map overlay will always show the pressure in hPa.
Barometric pressure forecasts play a vital role in predicting weather changes and their effects on health and various activities. Sonuby Weather makes these forecasts accessible through intuitive graphs and map overlays, offering both immediate and long-term pressure insights.
Whether you’re managing weather sensitivity, planning outdoor activities, or simply want to stay informed about atmospheric conditions, Sonuby’s customizable pressure forecasts provide the information you need at a glance. With multiple ways to view and track barometric pressure changes—from hourly updates to 14-day projections—you can make more informed decisions based on how upcoming pressure systems might affect you.
Download Sonuby today and experience the benefits of having comprehensive barometric pressure forecasts right at your fingertips.