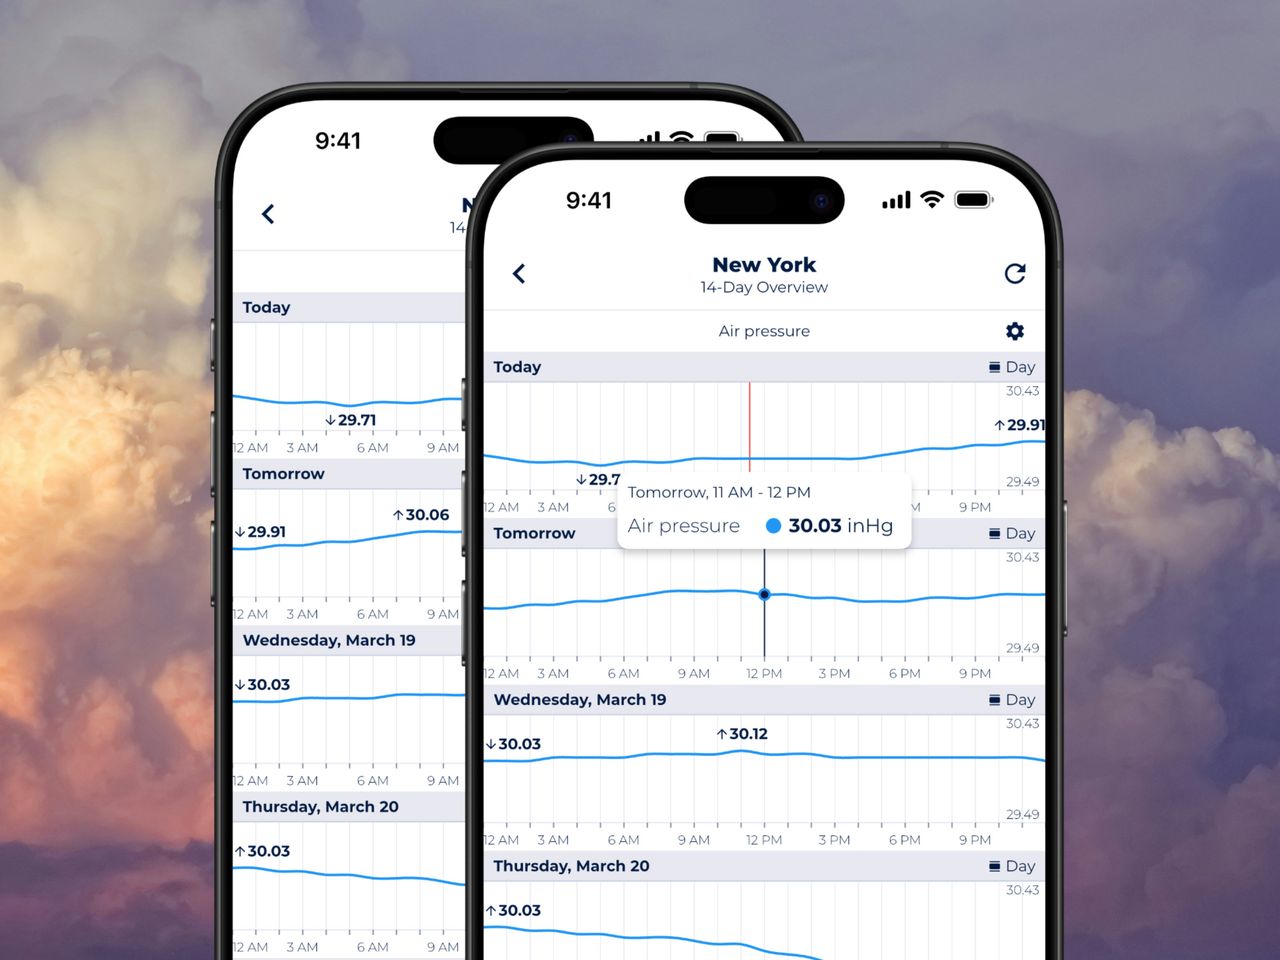
Sonuby Weather shows barometric pressure as an interactive graph for the next 14 days, twice the usual 7-day range. Each day’s graph shows how the pressure moves hour by hour in hPa or inHg, with that day’s high and low, so you can see when pressure will rise or fall. The app is free on iOS and Android.
If you track pressure because of migraines, joint pain or outdoor plans, start with the Health report: it shows barometric pressure graphs prominently in every forecast area.
Sonuby is a full weather app with pre-built reports for activities and scenarios such as Health, Daily Life and Sailing, and pressure forecasts are available in all of them. For a step-by-step tour of every place the graphs appear, see Complete Guide: Sonuby’s Barometric Pressure Forecasts.
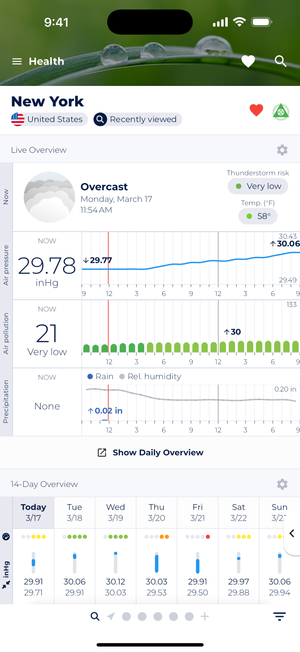
The Live Overview forecast available in the Health report shows a barometric pressure graph for the upcoming hours.
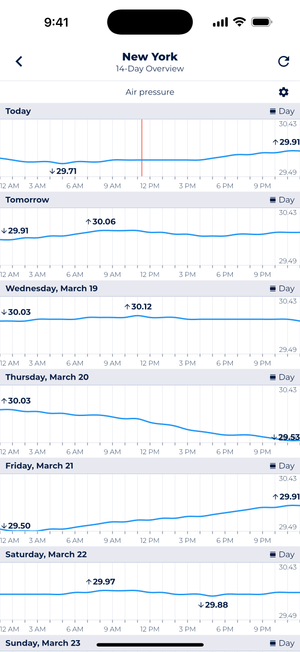
Barometric pressure graphs are available throughout the app, in this case as part of the 14-Day Overview.
Sonuby’s barometric pressure graphs aren’t just static images—they’re powerful tools that let you:
These interactive elements transform raw data into actionable insights, helping you make informed decisions about your health and activities.
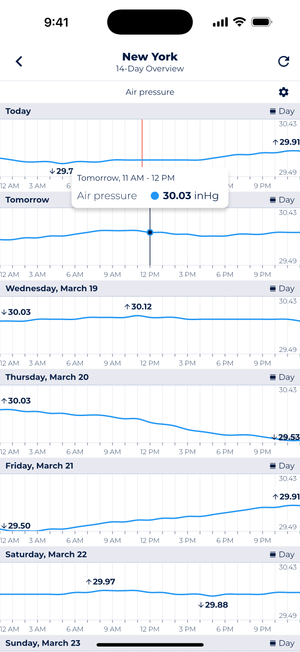
You can tap on the graph to see the forecasts for the specific time frame.
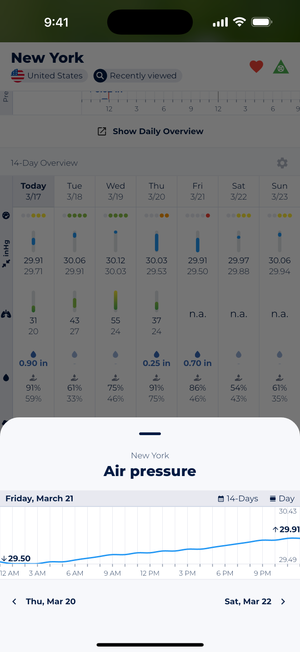
The graph is also accessible from within the 14-Day Overview. This way you can go to a specific day.
Just downloaded to track the barometer as it seems to affect my fibromyalgia and chronic fatigue. […] I’m giving it a 5 right now for all the detailed work the developer has put in, including an intro video with instructions. Not only is there a barometric pressure reading but also air pollution which will be helpful for my asthma. I’m really hopeful this app will be helpful to me for my health issues so I’ll put it on my home page.
Michelle via Google Play
Best weather app ever, hands down. I love the customization. The health option is amazing, especially the barometric pressure tracker. […] Thank you for the app and the walk through provided!
Emily via Google Play
Download Sonuby Weather today and try its extended barometric pressure graphs for yourself.
Look at the slope of a pressure graph: a line going up means pressure is rising, a line going down means it is falling. A single reading can't tell you the direction, you need readings over time. A forecast graph also shows you the rises and falls that are still to come.
Only slightly. Standard pressure at sea level is 29.92 inHg (1013.25 hPa) [1], so 29.88 inHg is just below it. For comparison, the New York forecast in the screenshots above moves between 29.50 and 30.12 inHg within one week. Whether pressure is falling or rising tells you more about the coming weather than one reading does.
Often, yes. Falling pressure is associated with stormy weather and rising pressure with fair weather [2]. A sudden fall usually means strong wind, and pressure that falls a lot and stays low points to rain within a few days [1]. It's a sign, not a guarantee: in the tropics, pressure changes too little from day to day to follow these rules [1].
For the weather, high pressure usually comes with fair weather and low pressure with unsettled, stormy weather [2]. For your body, one study linked knee osteoarthritis pain to changes in barometric pressure and in temperature [3].
It differs from person to person. In a study of 200 people with knee osteoarthritis, changes in barometric pressure and in temperature were each linked to how bad the pain was. [3] Comparing your symptoms with a pressure graph is the most practical way to find your own pattern. Read more in our guides to migraine weather forecasts and arthritis weather forecasts.
In Sonuby Weather's Health report. Open the 14-Day Overview and tap any day's pressure forecast to see that day's detailed graph, or long-press it and choose 14-Day Overview to see graphs for all 14 days. The barometric pressure guide walks through each step.
Resources:
[1] National Oceanic and Atmospheric Administration: Air pressure
[2] National Weather Service: Pressure
[3] McAlindon, T., Formica, M., Schmid, C. H., & Fletcher, J. (2007). Changes in Barometric Pressure and Ambient Temperature Influence Osteoarthritis Pain. The American Journal of Medicine, 120(5), 429-434. https://doi.org/10.1016/j.amjmed.2006.07.036